
How I Divided Loading Time by 10: Performance Optimization
An e-commerce site took 8 seconds to load. Google downgraded it. Solution: complete optimization. Result: 0.8 seconds, +25% conversion, +15,000€/month.

Updated

How I Divided Loading Time by 10 🚀⏱️
A client calls me in panic:
"Google downgraded us. Our clients complain. The site takes 8 seconds to load on mobile."
In e-commerce, 1 second delay = -7% conversion.
8 seconds = commercial suicide.
I audited the site. It was an invisible disaster. And this is exactly the kind of situation where methodical web performance optimization changes everything: not a magic wand, but a series of measured fixes that take a site from "slow" to "instant." In this guide, I break down the full process — why speed matters, how to measure it, and every technical lever to pull.
Why is web performance optimization decisive?
Performance is not a purist's topic. It's a topic of money, search ranking, and respect for the visitor.
On conversion. The slower a page, the more users abandon it. For years, studies from Google and major e-commerce players have converged: every hundred milliseconds saved translates into extra carts. On mobile, where networks are unstable, the effect is even stronger.
On SEO. Since 2021, Google has folded page experience (the Core Web Vitals) into its ranking signals. A fast site doesn't magically jump to first place, but a slow site forfeits a positive signal and hurts its click-through rate. Speed is one factor among many, not the only one — but it's one you fully control.
On UX and brand. A fast site inspires trust. A slow site feels like a sloppy product, even if everything else is excellent. First impressions are made in the first two seconds.
On cost. An optimized site consumes less bandwidth, less server CPU, and is cheaper to run at scale. Performance is also infrastructure savings.
A telling point: according to Google's field analyses, pages that hit the "good" thresholds on all three Core Web Vitals show markedly lower abandonment rates. The correlation between speed and engagement is one of the most robust on the web — and it holds across every sector, from media to e-commerce.
Keep the core idea in mind: web performance optimization serves the user, the search engine, and your bottom line simultaneously. It's one of the rare technical projects with directly measurable ROI.
What are the Core Web Vitals (LCP, INP, CLS)?
Before optimizing, you need to know what you're measuring. Google standardized three metrics that summarize perceived experience: the Core Web Vitals. They are public, documented on web.dev, and assessed at the 75th percentile of real loads (in other words: the experience of the worst-served 25% of users must stay decent).
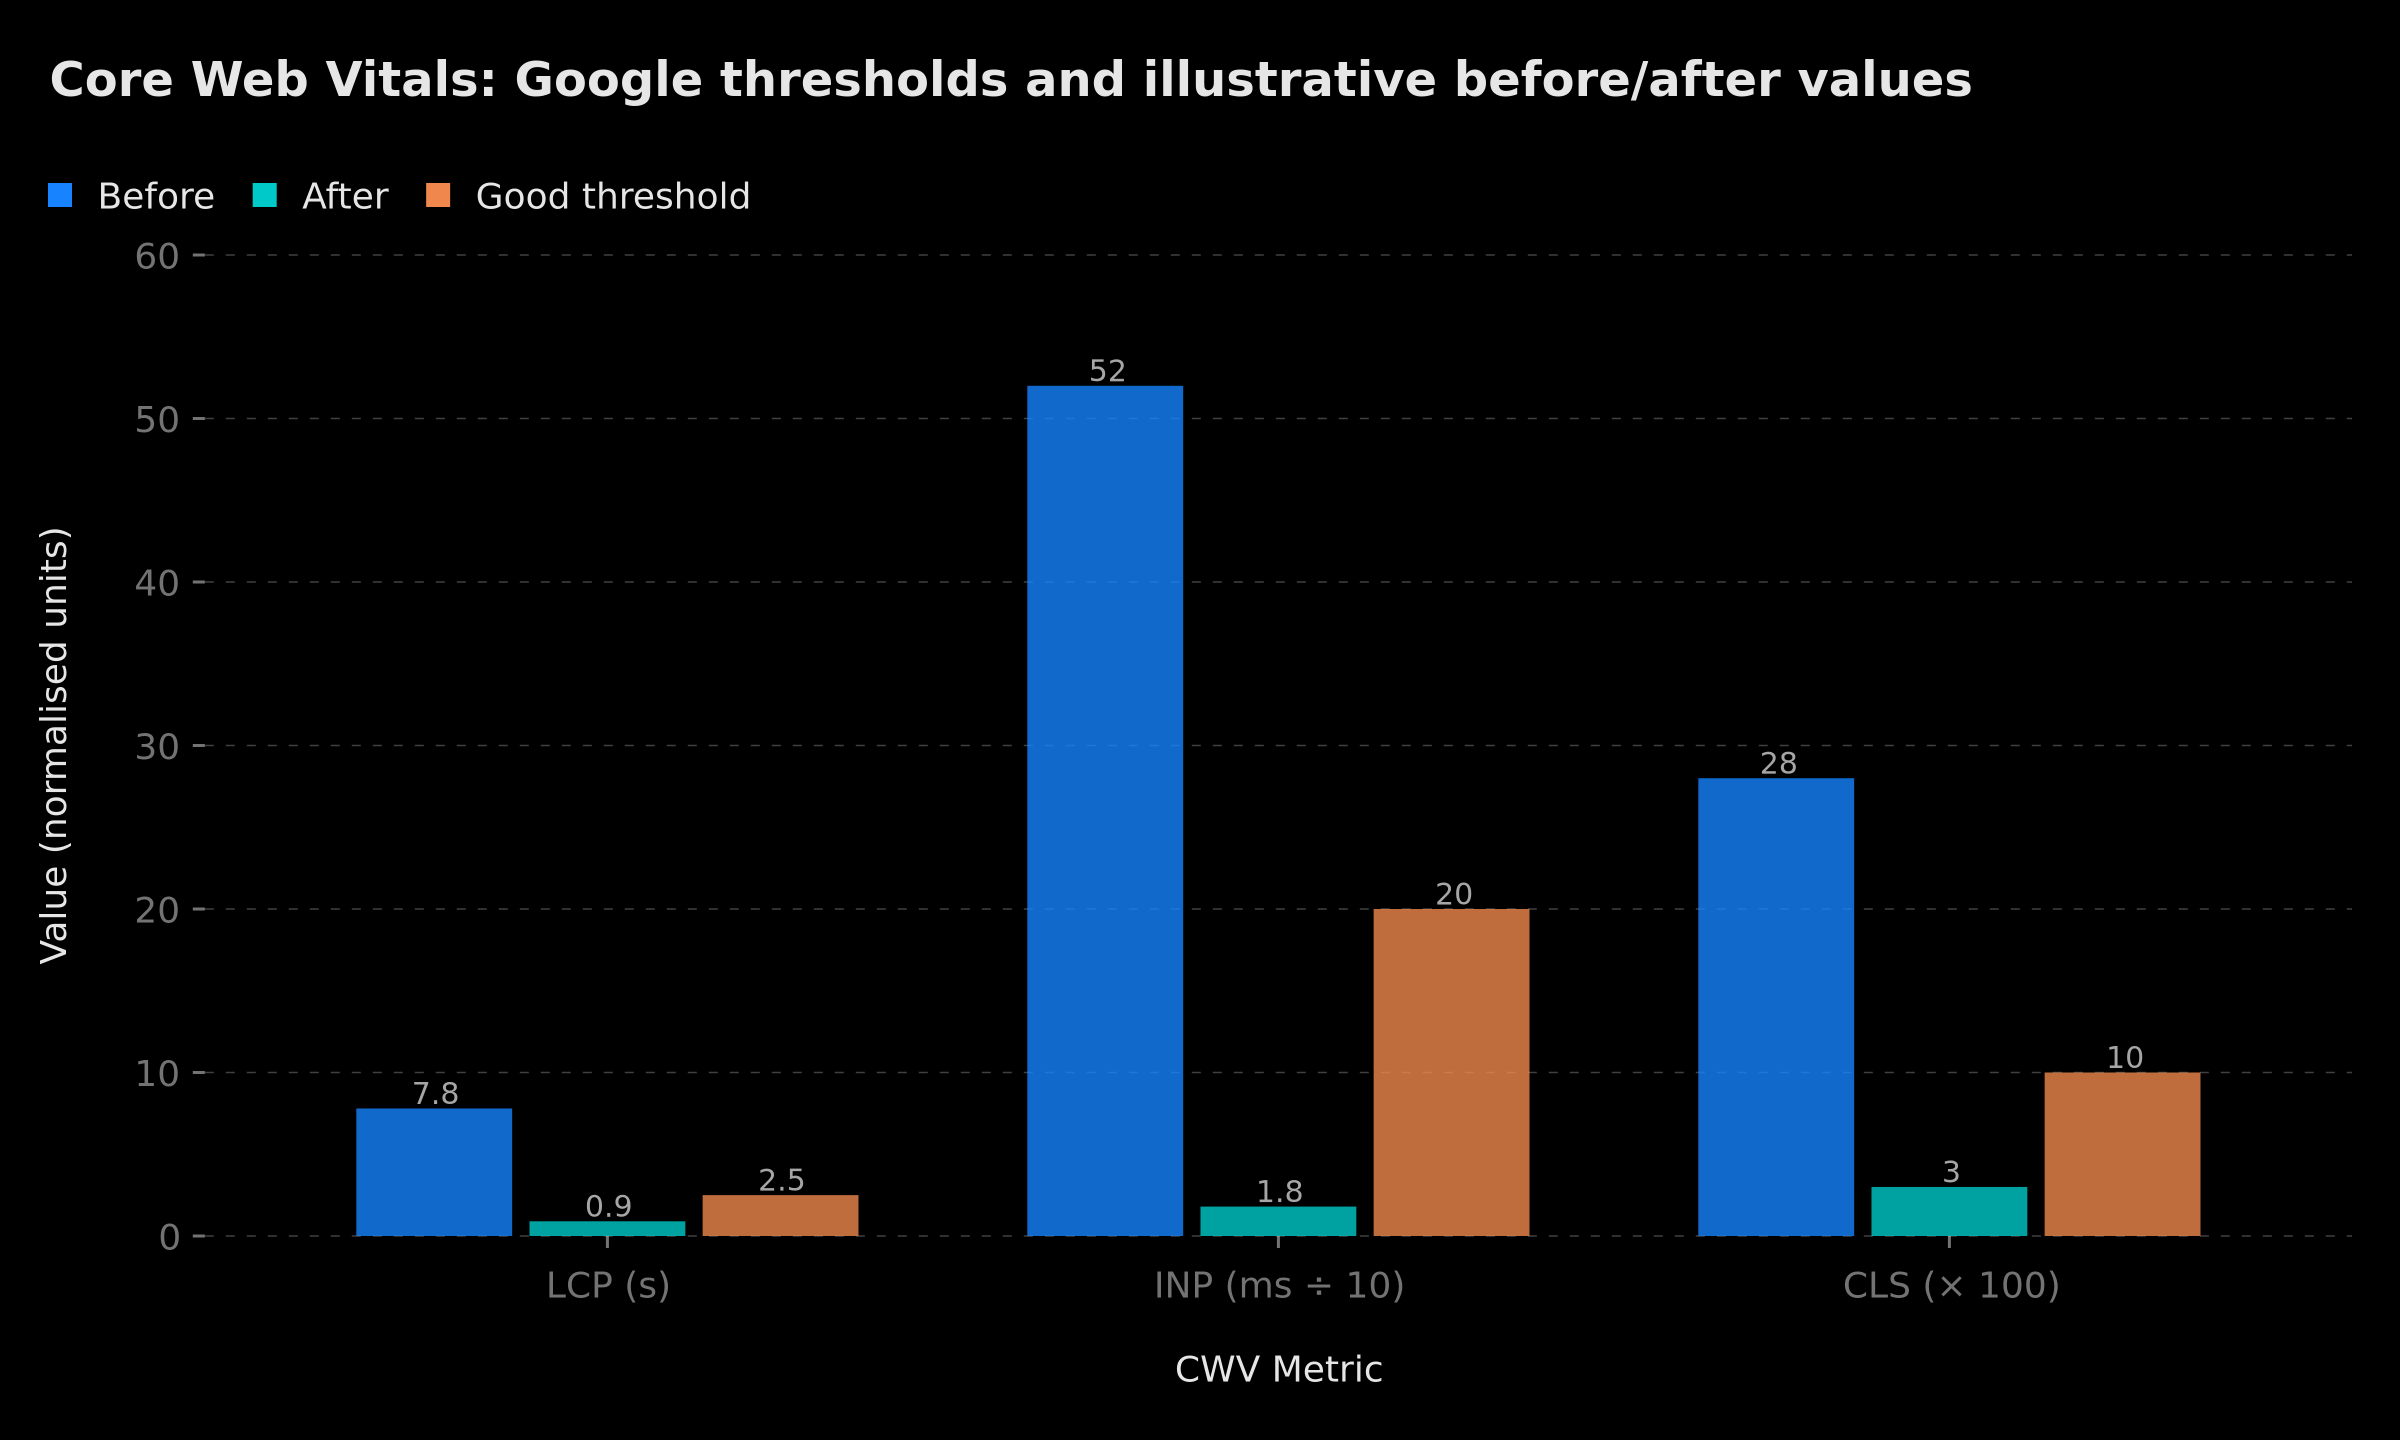 The three Core Web Vitals with their 'good' thresholds per Google (web.dev) and an illustrative example of progress after optimization. The 'after' values are demonstration orders of magnitude, not a guarantee.
LCP — Largest Contentful Paint (loading speed)
LCP measures the time needed to render the largest visible element on screen (often a hero image, a video, or a large text block). It's Google's proxy for "the page looks loaded."
Official thresholds (web.dev):
- Good: ≤ 2.5 seconds
- Needs improvement: between 2.5 and 4 seconds
- Poor: > 4 seconds
LCP is often dragged down by oversized images, a slow server response, or render-blocking resources.
INP — Interaction to Next Paint (responsiveness)
INP replaced FID in March 2024 as the responsiveness metric. It measures the latency between a user interaction (click, tap, key press) and the next visual update on screen. Put simply: when I click, does it respond quickly?
Official thresholds:
- Good: ≤ 200 milliseconds
- Needs improvement: between 200 and 500 milliseconds
- Poor: > 500 milliseconds
INP degrades mostly because of a main thread saturated by heavy JavaScript. It's the metric most tied to the amount of JS executed.
CLS — Cumulative Layout Shift (visual stability)
CLS measures unexpected visual shifts: that frustrating moment when you're about to click a button and an ad or image loads, pushing all the content down.
Official thresholds:
- Good: ≤ 0.1
- Needs improvement: between 0.1 and 0.25
- Poor: > 0.25
Typical culprits: images without explicit dimensions, fonts that change the layout, content injected dynamically above the fold.
How do you measure a website's performance?
You don't optimize blind. The golden rule: measure before, measure after, and cross two types of data.
Lab data. A reproducible test in a controlled environment. Ideal for diagnosing and comparing versions.
- Lighthouse (built into Chrome DevTools): full audit for performance, accessibility, SEO, with a score out of 100 and actionable recommendations.
- PageSpeed Insights: a web interface combining Lighthouse (lab) and CrUX data (field) for a given URL.
- WebPageTest: the reference tool for fine analysis — request waterfall, testing from different locations, varied network and device profiles.
Field data (RUM). Real User Monitoring measures the actual experience of real visitors, on their real devices and networks. This is what Google actually uses for Core Web Vitals via the Chrome User Experience Report (CrUX).
The difference is crucial: a Lighthouse score of 100 obtained over fiber on a MacBook says nothing about the experience of a user on a low-end phone over 4G. Lab is for diagnosis; field is for judgment. Good web performance optimization relies on both.
Practical tip: always run Lighthouse in incognito (no extensions) and in "mobile" mode with throttling, otherwise your numbers are too optimistic.
To track your Core Web Vitals over time, Google Search Console offers a dedicated report, fed by CrUX data. It's the dashboard to watch: it reflects exactly what Google "sees" of your site, URL by URL, over a rolling 28-day window.
How I went from 8s to 0.8s in 48h
Time for the concrete case. Here are the four levers that produced most of the gain on this e-commerce site. The figures below are from this specific project — they illustrate the method, they are not a universal promise.
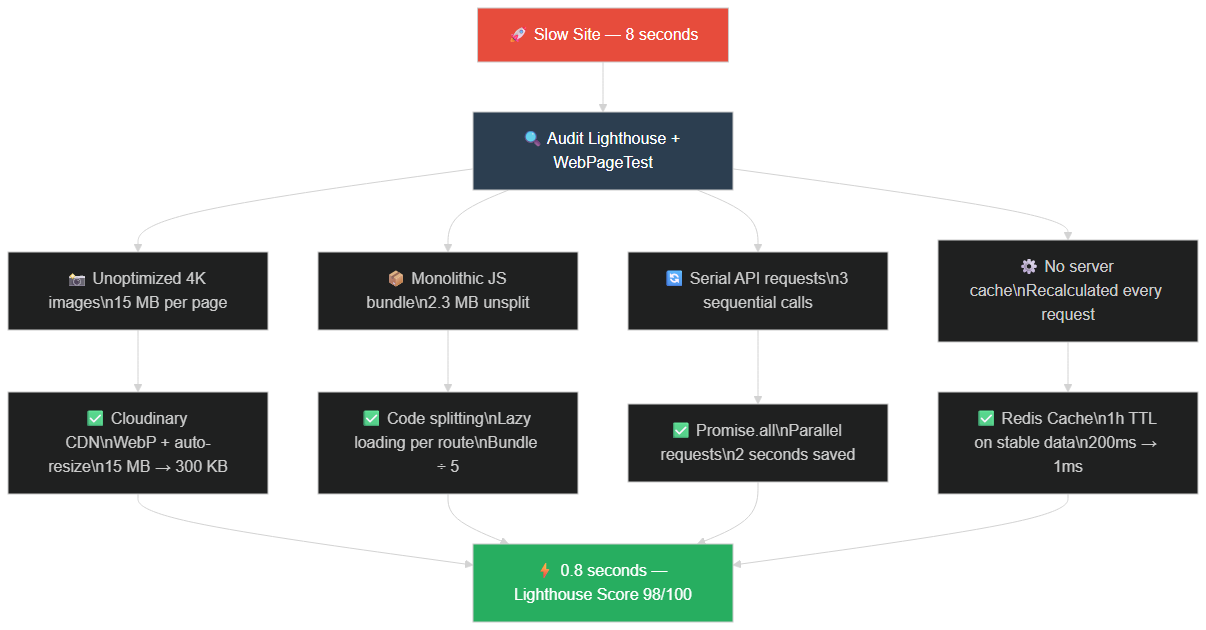 The 4 levers that divided load time by 10: Cloudinary images, lazy loading, parallel requests, and Redis cache.
1. The problem of giant images 🖼️
The client uploaded 4K photos directly from their camera (5 Mo per image).
Solution: Cloudinary pipeline setup.
→ Automatic resizing + WebP conversion.
→ Gain: 15 Mo → 300 Ko per page.
Implementation:
// Before: Raw 5 Mo image
<img src="/uploads/product-4k.jpg" />

// After: Optimized 50 Ko image
<img
  src="https://res.cloudinary.com/xxx/image/upload/w_800,q_auto,f_webp/product.jpg"
  loading="lazy"
/>
2. Dead code 🧟♂️
The site loaded EVERYTHING (Admin, Payment, Chat) on the homepage.
Solution: code splitting & lazy loading.
→ We only load "Cart" code if the user clicks "Cart".
→ Gain: JS bundle divided by 5.
Implementation:
// Before: Everything loaded
import AdminPanel from './AdminPanel';
import PaymentForm from './PaymentForm';
import ChatWidget from './ChatWidget';

// After: Lazy loading
const AdminPanel = lazy(() => import('./AdminPanel'));
const PaymentForm = lazy(() => import('./PaymentForm'));
const ChatWidget = lazy(() => import('./ChatWidget'));

// Only loaded when needed
<Suspense fallback={<Loading />}>
  {showCart && <PaymentForm />}
</Suspense>
3. Serial requests 🐢
The site asked: "Give me the User" → wait → "Give me their orders" → wait.
Solution: parallel requests (Promise.all).
→ We ask everything at the same time.
→ Gain: 2 seconds saved.
Implementation:
// Before: Serial (3 seconds)
const user = await fetchUser();
const orders = await fetchOrders(user.id);
const cart = await fetchCart(user.id);

// After: Parallel (1 second)
const [user, orders, cart] = await Promise.all([
  fetchUser(),
  fetchOrders(user.id),
  fetchCart(user.id)
]);
4. Intelligent cache 🧠
The site recalculated the menu on every visit.
Solution: Redis Caching.
→ We calculate once, serve 10,000 times.
→ Gain: instant server.
Implementation:
// Before: Recalculate every time
function getMenu() {
  return calculateMenu(); // 200ms
}

// After: Redis cache
async function getMenu() {
  const cached = await redis.get('menu');
  if (cached) return JSON.parse(cached);

  const menu = calculateMenu();
  await redis.setex('menu', 3600, JSON.stringify(menu)); // Cache 1h
  return menu;
}
How do you optimize images for the web?
Images often represent half or more of a page's weight. It's the first project of any web performance optimization effort, and the most rewarding.
Choose modern formats. WebP reduces weight by 25 to 35% versus JPEG at equal quality. AVIF goes further (often 50% lighter than JPEG), at the cost of slower encoding. Serve AVIF first with a WebP then JPEG fallback via the <picture> tag.
Size correctly. Never serve a 4000px-wide image in a 400px container. Use srcset and sizes to deliver the right size per screen. A phone doesn't need the desktop version.
Lazy loading. Images outside the visible area load only as they approach. loading="lazy" is enough in most cases. Warning: never lazy-load the LCP image (often the hero) — it must load immediately, ideally with fetchpriority="high".
Always set width and height. This is the number-one defense against CLS: the browser reserves the space before the image even arrives, so nothing "jumps."
<picture>
  <source srcset="/img/hero.avif" type="image/avif" />
  <source srcset="/img/hero.webp" type="image/webp" />
  <img src="/img/hero.jpg" width="1200" height="630"
       fetchpriority="high" alt="..." />
</picture>
A common refinement is to offload these transforms to an image CDN (Cloudinary, imgix, or a framework's built-in loader). You store one high-resolution original, and the CDN generates the right format, quality and dimensions on the fly, cached at the edge. This keeps your codebase simple while serving every device its ideal image — and it's exactly the pipeline used in the case study above.
If you use Next.js, the <Image> component automates most of these optimizations (formats, dimensions, lazy loading, responsive sizes).
How do you reduce JavaScript weight?
JavaScript is the silent poison of performance. Unlike an image, it must be downloaded, parsed, compiled, then executed — all on the main thread, the very one that must respond to clicks. It's the number-one cause of poor INP.
Code splitting. Don't ship a monolithic bundle. Split by route and by component so the user only downloads the code for the page they're viewing (that's what we did in step 2 of the client case).
Tree shaking. Configure your bundler (Vite, webpack, esbuild) to eliminate dead code — functions imported but never used. Import granularly (import { debounce } from 'lodash-es') rather than the whole library.
Master hydration. In a server-rendered app, "hydration" is the step where JavaScript takes over the HTML. If the whole page hydrates at once, the thread blocks. Modern approaches (Server Components, selective hydration, streaming) only load JS where it's needed. To go further, Next.js Partial Pre-Rendering combines the best of static and dynamic.
Defer third-party scripts. Analytics, chat, A/B testing, ad pixels: these are often the biggest culprits behind a saturated thread. Load them with defer, or after interaction, or via a web worker (Partytown).
Also audit your bundle composition. Tools like webpack-bundle-analyzer or Next.js's --analyze flag reveal which dependencies weigh the most. Very often, a single poorly chosen library (a full date library, an entire icon suite) accounts for half the weight — and swapping it for a lighter alternative fixes the problem in an hour.
If your app stays slow despite a lighter bundle, the problem often lies elsewhere: a poorly designed state management that re-renders entire components on every keystroke.
Should you optimize critical CSS and fonts?
Yes — these are two render-blocking resources that are too often neglected.
Critical CSS. The browser renders nothing until it has the CSS needed for the above-the-fold area. The technique: extract this critical CSS and inline it in a <style> directly in the <head>, then load the rest of the CSS asynchronously. Result: the first render appears without waiting for the entire stylesheet to download.
Web fonts. A poorly handled font causes either invisible text (FOIT) or a layout shift when the font arrives (FOUT → CLS). Best practices:
font-display: swapto immediately show fallback text;- preload the critical font with
<link rel="preload" as="font">; - limit the number of weights and variants;
- prefer
woff2formats (the most compressed); - consider system fonts when the design allows it (zero download).
<link rel="preload" href="/fonts/inter.woff2" as="font"
      type="font/woff2" crossorigin />
Cache and CDN: how do you speed up delivery?
The fastest content is the one you don't have to recalculate or send back from the other side of the world.
Browser cache (HTTP). Configure aggressive Cache-Control headers on static resources (JS, CSS, images, fonts) versioned by a hash in their name. Once downloaded, they're never requested again until they change.
Server / application cache. Memoize expensive results (complex queries, renders, third-party API calls) in a cache like Redis, exactly as in step 4 of the client case. You turn a 200ms computation into a 1ms read.
CDN (Content Delivery Network). A CDN replicates your resources across servers around the world. A visitor in Tokyo is served from a server near Tokyo, not from your datacenter in Europe. Typical gain: tens to hundreds of milliseconds of latency removed, and a relieved origin server. Modern CDNs also cache full pages and run code at the edge.
The hierarchy to remember: browser → CDN → application cache → database. Every layer you skip is time saved.
Compression and network protocol: an often-forgotten gain
Two server settings, almost free, speed up all your text resources.
Gzip or Brotli compression. HTML, CSS and JavaScript are text: they compress extremely well. Brotli, newer than Gzip, cuts another 15 to 20% off these files. Most servers and CDNs enable it with one line of configuration. It's one of the best effort/gain ratios in all of web performance optimization.
HTTP/2 and HTTP/3. These modern protocols multiplex several requests over a single connection, remove head-of-line blocking, and reduce latency. HTTP/3 (based on QUIC) shines especially on unstable mobile networks. Check that your host serves them: it often does, but not always enabled by default.
Which rendering mode should you choose (SSR, SSG, streaming)?
The rendering mode determines where and when your HTML is generated. It's a major architectural choice for performance.
- SSG (Static Site Generation): pages are generated at build time, once and for all, and served as static HTML via the CDN. The fastest possible. Ideal for content that changes little (blog, marketing, documentation).
- SSR (Server-Side Rendering): HTML is generated on the server on every request. Necessary for highly personalized or real-time content, at the cost of a higher TTFB.
- ISR (Incremental Static Regeneration): a compromise that regenerates static pages at regular intervals, in the background.
- Streaming SSR: the server sends HTML in chunks as soon as they're ready, without waiting for everything to be computed. The user sees content appear progressively instead of staring at a blank page.
The trend in modern frameworks (Next.js, Astro, Remix) is hybridization: static by default, dynamic only where needed, all with streaming. If you're starting a project, look at what Next.js 16 changes on this front.
A practical rule of thumb: make a page static unless it truly needs per-request data. Most marketing and content pages have no reason to be server-rendered on every hit — and static pages are not only faster, they're also cheaper to serve and far more resilient under traffic spikes.
Backend and database: the hidden optimizations
Perceived performance doesn't stop at the browser. If your server takes 2 seconds to respond, no front-end optimization will save your LCP.
TTFB (Time To First Byte) is the delay before the server sends the first byte. A high TTFB almost always reveals a backend problem: slow query, synchronous computation, or waiting on a third-party API.
The most rewarding backend projects:
- Index the database. A query without an index on a large table does a full scan. A well-placed index turns seconds into milliseconds.
- Eliminate N+1 queries. The classic trap: looping over 100 items and firing one query per item. Batch into a single query (join,
IN, or dataloader). - Parallelize independent calls (the client case's
Promise.all). - Cache stable results.
- Enable connection pooling. Opening a database connection is expensive; reusing them avoids an invisible bottleneck under heavy load. On the API side, paginate large responses rather than returning everything at once.
These optimizations don't show up in Lighthouse, but they condition everything else. And neglecting this debt ends up costly: a poorly architected system becomes 5 times more expensive to maintain.
Where do you start? The prioritized checklist
The classic mistake is to optimize everything at once with no method. Here's the order I recommend, from most rewarding to most fine-grained.
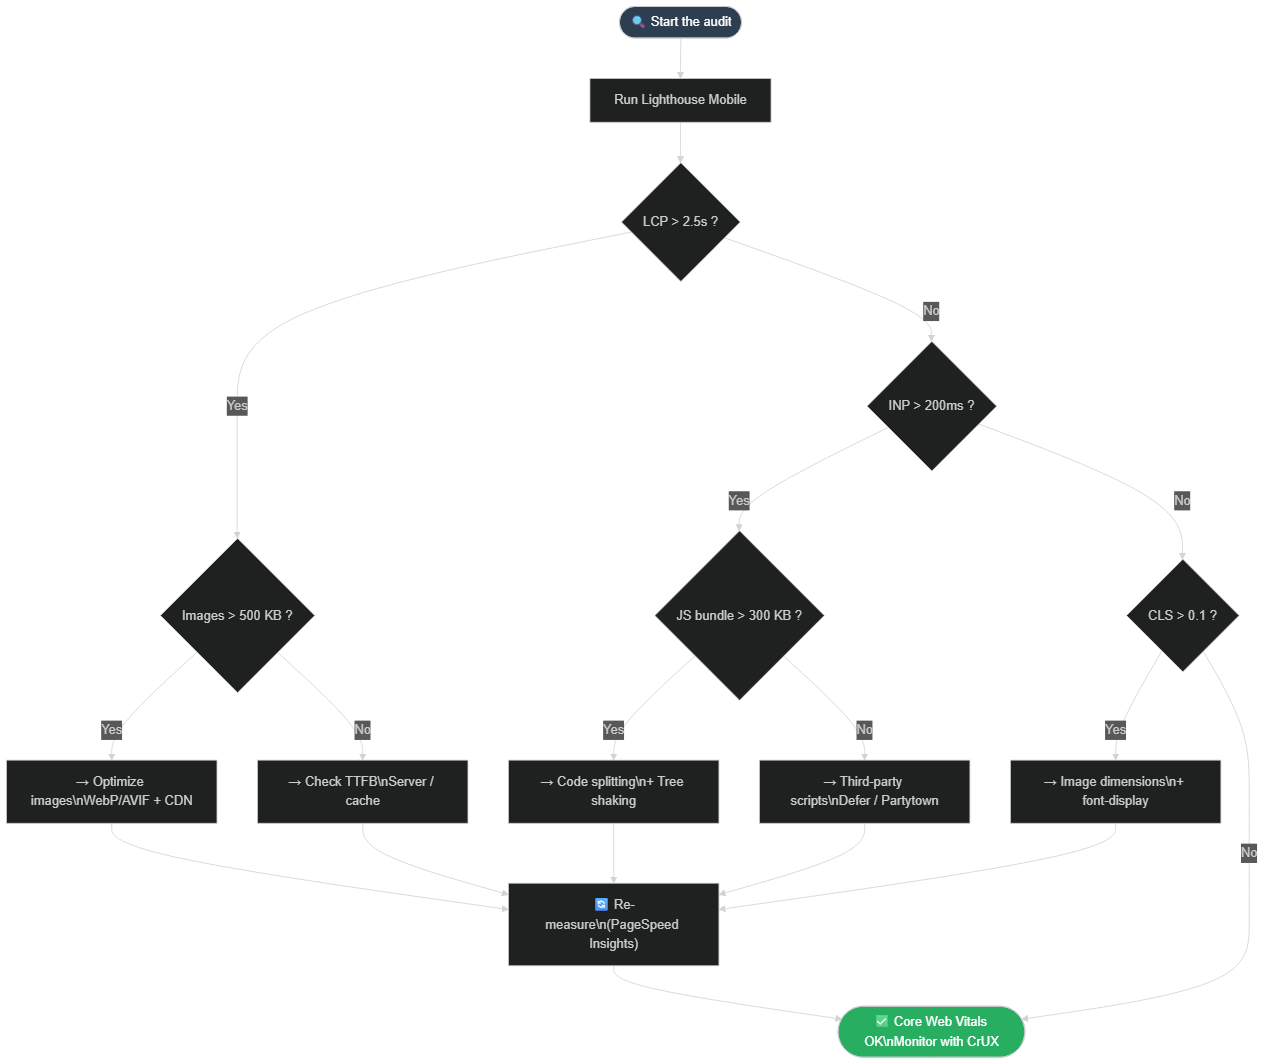 Decision tree to prioritize: first identify the weak link (image, JS, server or visual shift) before choosing the matching optimization lever.
- Measure first. Run Lighthouse + PageSpeed Insights, note your starting LCP, INP and CLS. Without a baseline, you'll never know if you're improving.
- Tackle images. Modern formats, dimensions, lazy loading. Often 40 to 60% of weight removed for moderate effort.
- Split the JavaScript. Code splitting, dead-code removal, deferring third-party scripts. It's the main lever for INP.
- Enable cache and CDN. HTTP headers, CDN, application cache. Immediate gain on TTFB and returning visitors.
- Stabilize the layout. Image dimensions,
font-display, space reservation for dynamic content. The anti-CLS recipe. - Optimize the backend. Indexes, N+1 queries, parallelization — when TTFB stays the weak link.
- Re-measure and iterate. Optimization is a cycle, not an event.
The relative impact of these levers is summarized below — based on this client case, so for illustration only: your numbers will depend on your starting point.
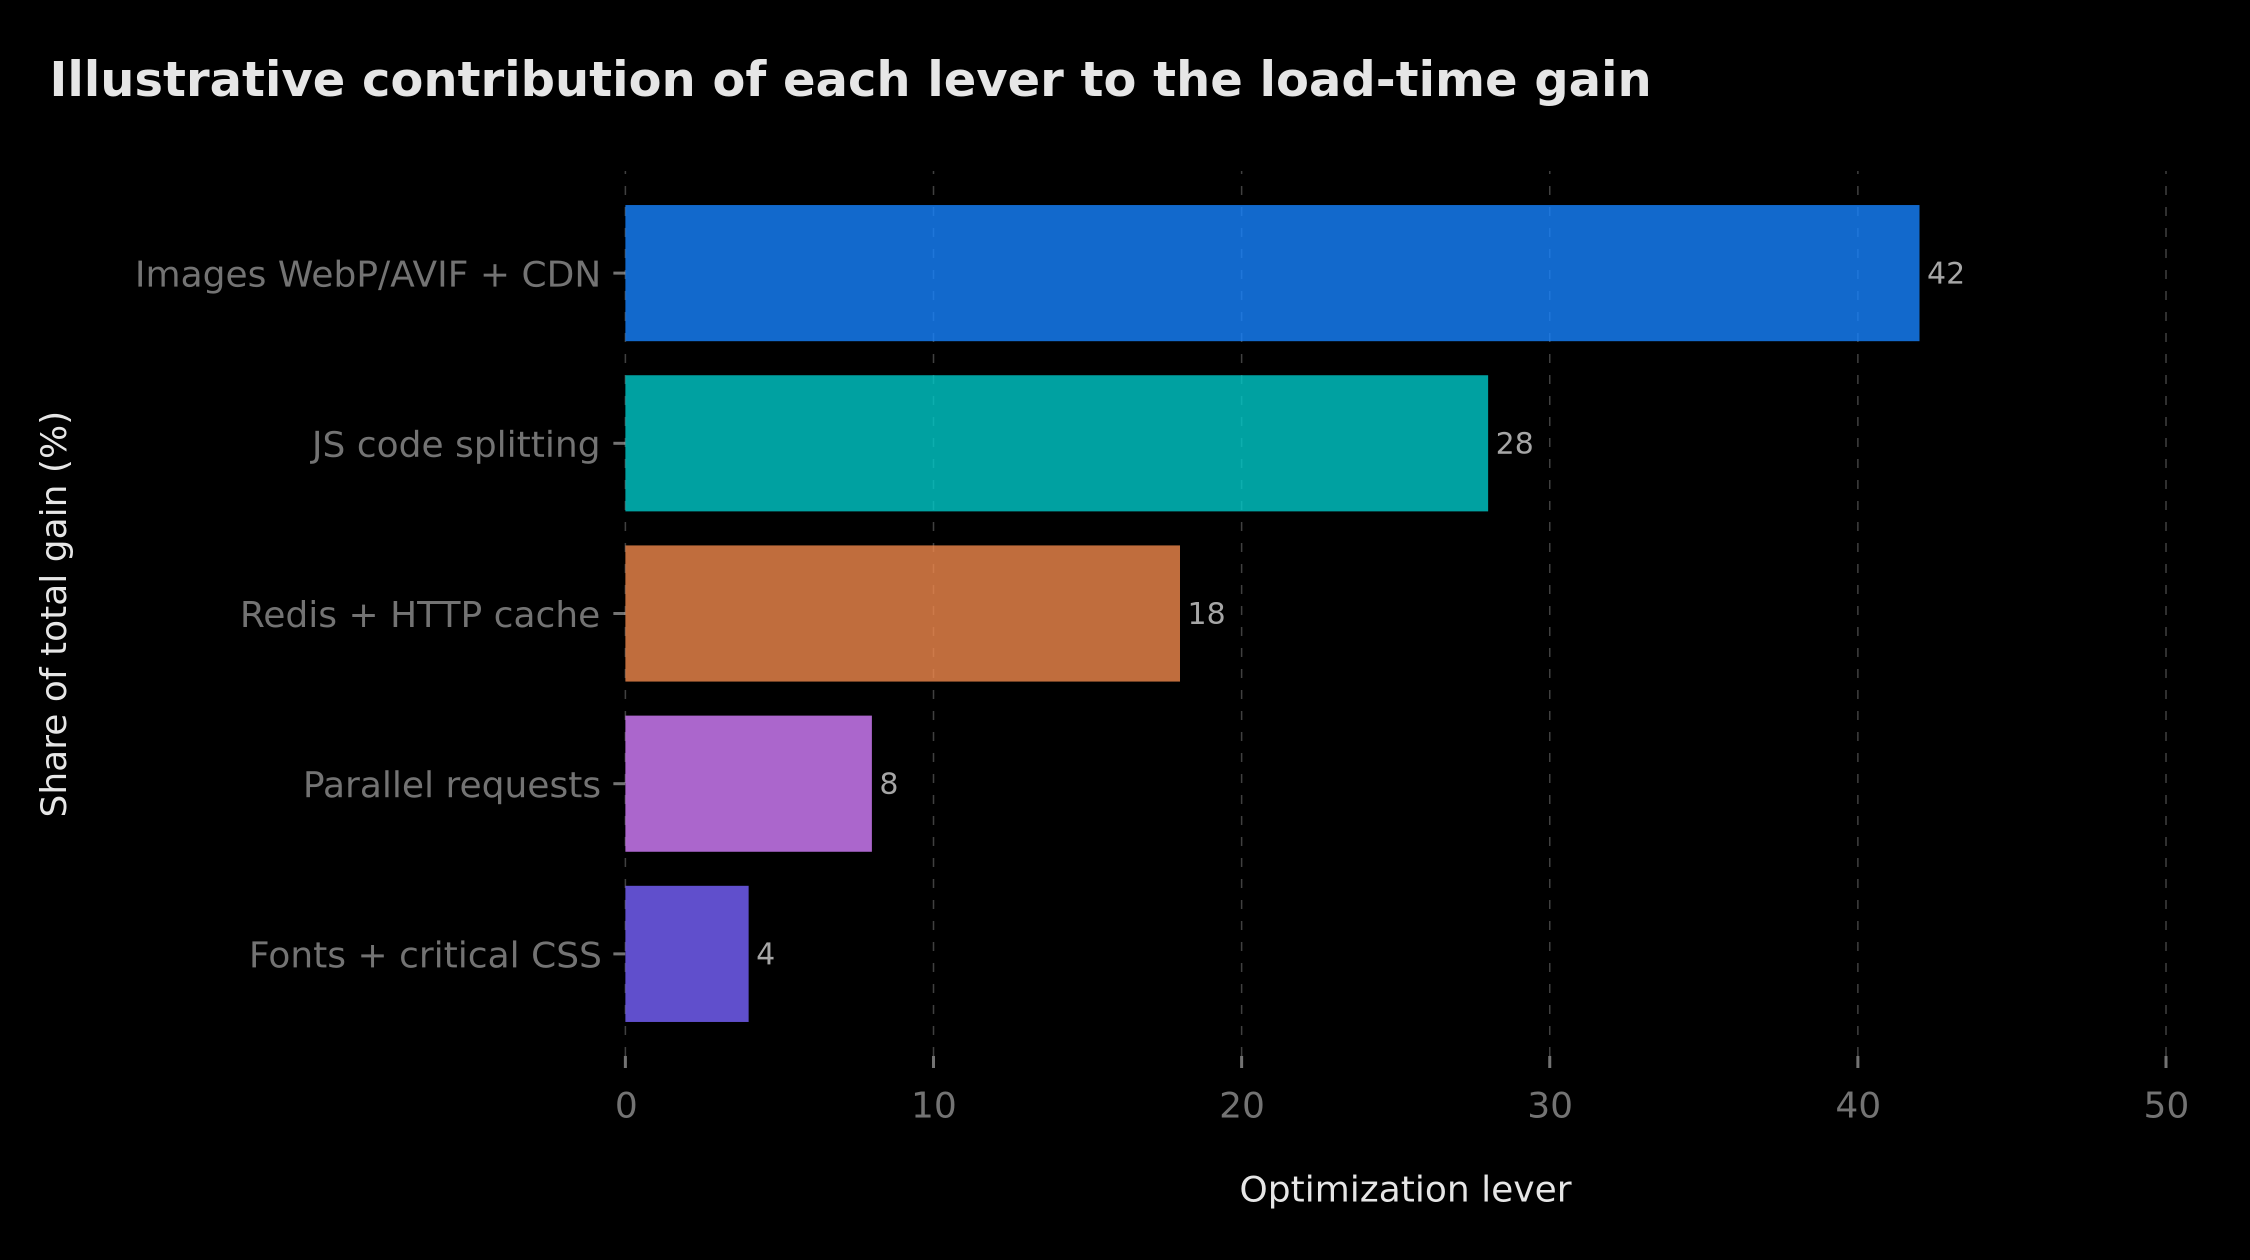 Illustrative breakdown of time saved per optimization lever on the studied e-commerce case. These proportions vary widely from one project to another.
What results do you get by dividing load time by 10?
On this specific project, after 48h of web performance optimization:
✅ Loading time: 0.8 seconds (Lighthouse Score 98/100)
✅ Bounce rate: -40% (people stay)
✅ Conversion: +25% in one week
✅ Revenue: +15,000€/month just from speed.
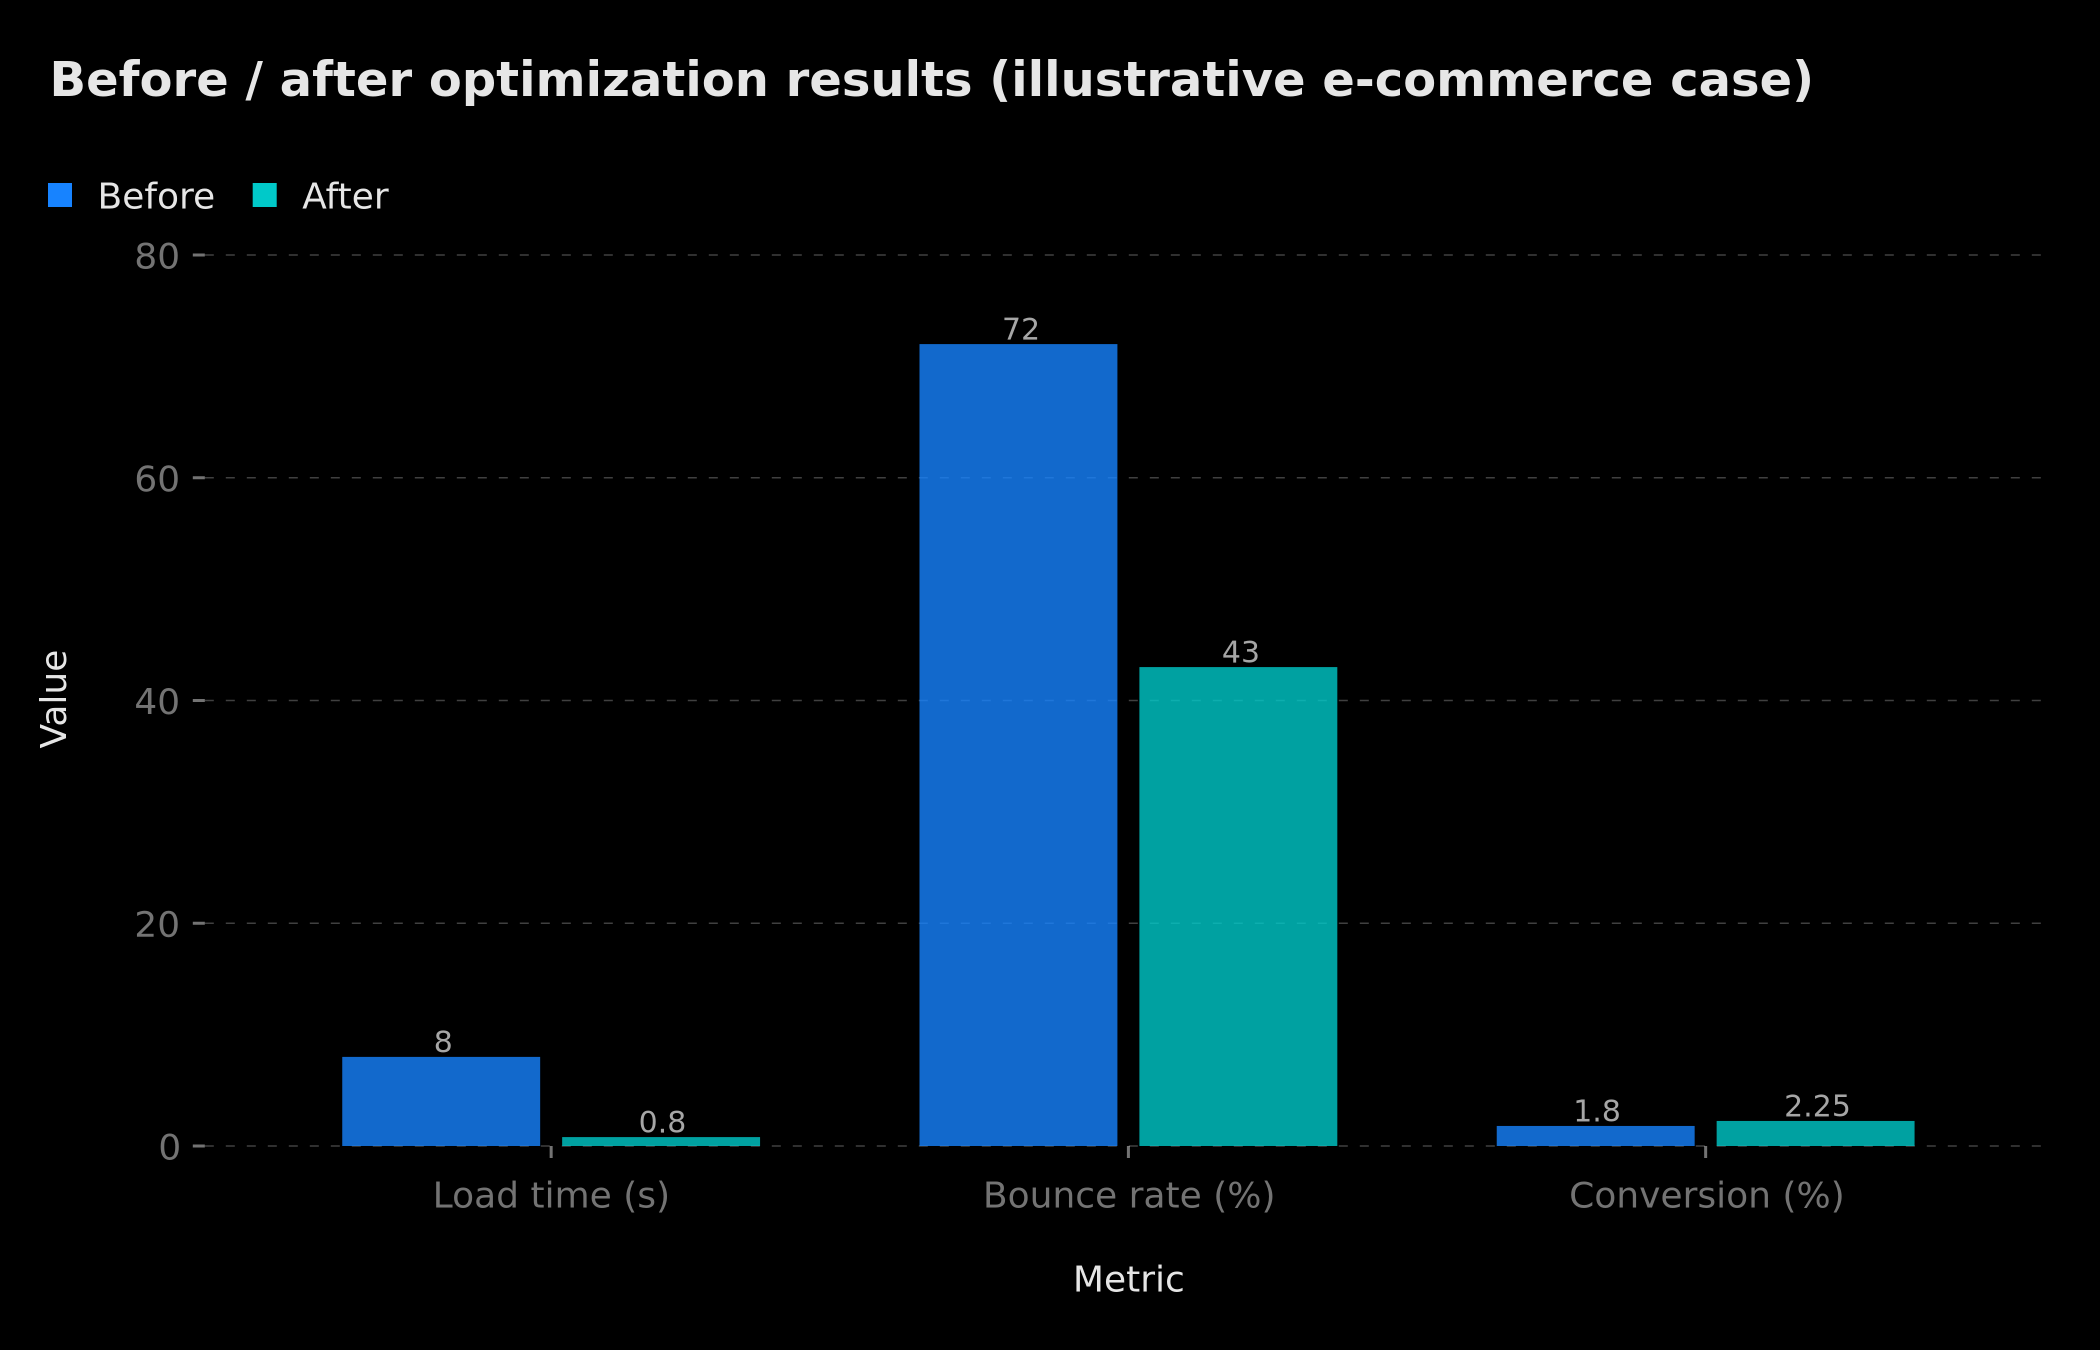 In 48h of optimization: load time divided by 10 (8s → 0.8s), bounce rate -40%, conversion +25% — a direct, measurable commercial impact on this specific case.
Again: a ÷10 factor is possible because this site started very far back. On an already-polished site, aim instead for a 20 to 40% gain — which is still very profitable. The right reflex isn't to chase a number, but to hit the "good" Core Web Vitals thresholds.
What makes this result possible
It's not magic. It's engineering.
Many developers (and AI) are content to "make code work." An expert asks "how does it work FAST."
AI can help you optimize (e.g., "rewrite this function to be faster"), but it can't guess your global architecture. It's up to you to drive the strategy. And if your site holds the speed but collapses under traffic, automatic scalability is the next step.
For a business, performance IS money. Every second saved is a retained visitor, a closed sale, a reduced infrastructure cost. It's one of the best technical investments you can make.
Additional resources:
🚀 Complete Guide: Pro App Development I have a complete chapter on "Web & Mobile Performance": measurement tools (Lighthouse, Web Vitals), advanced optimization techniques, ready-to-use code. 👉 Access the Complete Guide
Is Your Site a Ferrari or a Tractor? 🚜🏎️ 👇
Tags
FAQ
What are the Core Web Vitals thresholds I should meet?
According to Google's documentation (web.dev), a site is rated "good" with an LCP ≤ 2.5s, an INP ≤ 200ms and a CLS ≤ 0.1. These thresholds are assessed at the 75th percentile of real loads, on mobile and desktop. Beyond 4s LCP, 500ms INP or 0.25 CLS, the experience is rated "poor".
How do I measure my website's performance?
Combine lab data (Lighthouse, PageSpeed Insights, WebPageTest) to diagnose, and field data (RUM, CrUX) to measure real visitor experience. Lab tools reproduce a controlled environment; RUM reflects the diversity of your users' devices and networks.
How can I improve my website's Core Web Vitals?
Key levers: image optimization (WebP/AVIF, lazy loading, explicit dimensions), removing render-blocking resources, deferring third-party scripts, code splitting JavaScript, and enabling HTTP cache + CDN. BOVO Digital performs PageSpeed audits to identify your priority improvement areas.
Can you really divide your loading time by 10?
A gain of that magnitude is possible on a very poorly optimized site (raw images, monolithic JavaScript, no cache), but it is not a universal guarantee. The multiplier depends entirely on your starting point. On an already-polished site, a 20–40% gain is more realistic — and already very profitable.
Which framework should I choose for a fast website in 2026?
Next.js 16 is a reference for high-performance web applications thanks to Server Components and Partial Pre-Rendering. For a simple showcase site, a well-configured Astro or WordPress remains viable. BOVO Digital guides you to the right technology for your budget and timeline.
Does your site book meetings — or just present you?
We open your URL together, mark the 3 leaks, and tell you whether a fix is enough or a rebuild is required.
- 30 min
- No commitment
- Action plan
Vicentia Bonou
Full Stack Developer & Web/Mobile Specialist. Committed to transforming your ideas into intuitive applications and custom websites.


