
Your Site Will Crash at the Worst Moment: Scalability Explained
The success paradox: your app works fine until an influencer talks about it. 10,000 visitors arrive, the server explodes. Warning signs, bottlenecks, CDN, Redis cache, auto-scaling, and load testing explained.

Updated
Your Site Will Crash at the Worst Moment 💥📉
Website scalability is one of the most underestimated topics among digital entrepreneurs. We talk about growth hacking, SEO, design — but rarely about what happens under the hood when your traffic suddenly explodes. Yet a website crash at the wrong moment can wipe out weeks of marketing work in minutes. This guide gives you the concrete keys to understand bottlenecks, anticipate traffic spikes, and build an infrastructure that holds under load.
This is the "Success Paradox": your application runs perfectly as long as nobody is watching. You tested locally, you tested in staging, everything is fine. Then an influencer mentions you on a Tuesday morning, or your Facebook campaign takes off on a Saturday night, and 10,000 people arrive at the same time. Your server explodes. The site is offline. People leave and never come back.
You succeeded in marketing, but failed in tech. The worst part is that this scenario is entirely predictable — and entirely preventable. You just need to know where to look.
What Are the Warning Signs That Your Website Is About to Crash?
A site never goes down without warning. There are always alarm signals that appear before a total outage. The problem is that most teams don't monitor them — or discover the alerts after the damage is done.
The first signal is creeping latency. Under normal conditions, your site responds in 200 to 400 milliseconds. As traffic climbs, latency gradually swells: 600ms, 1 second, 2 seconds. From 2 seconds at the p95 percentile (meaning 95% of your users are waiting at least 2 seconds), you are in the red zone. Google PageSpeed Insights considers an LCP above 4 seconds as a "poor" experience. Your users, however, typically leave well before that.
The second signal is 5xx errors appearing in your logs. A 503 Service Unavailable means your application server is saturated and refusing new connections. A 502 Bad Gateway indicates that the load balancer is no longer receiving a response from the backend. A 504 Gateway Timeout points to a backend that is responding, but too slowly. When the 5xx error rate exceeds 0.5% of your requests, it is an emergency.
The third signal comes from the database. Active connections reach the configured maximum (100 by default for PostgreSQL). Query response times climb. Locks appear in pg_stat_activity. Event tables grow abnormally. In many cases, the database is the real bottleneck, well before the application server CPU is saturated.
Finally, watch your server memory. When your application starts swapping (using the disk as RAM extension), performance collapses. A server with 8 GB of RAM at 95% memory utilization is two steps away from the OOM killer — the operating system mechanism that kills processes to free memory, sometimes taking your application down with it.
The good news is that all these signals are measurable, alertable, and automatable. A well-configured monitoring stack notifies you before the end user sees anything.
How to Identify Bottlenecks in a Web Application?
Before choosing a solution, you need to understand where the real problem is. Many teams add servers hoping things will "get better", without ever identifying the root cause. This is an expensive mistake.
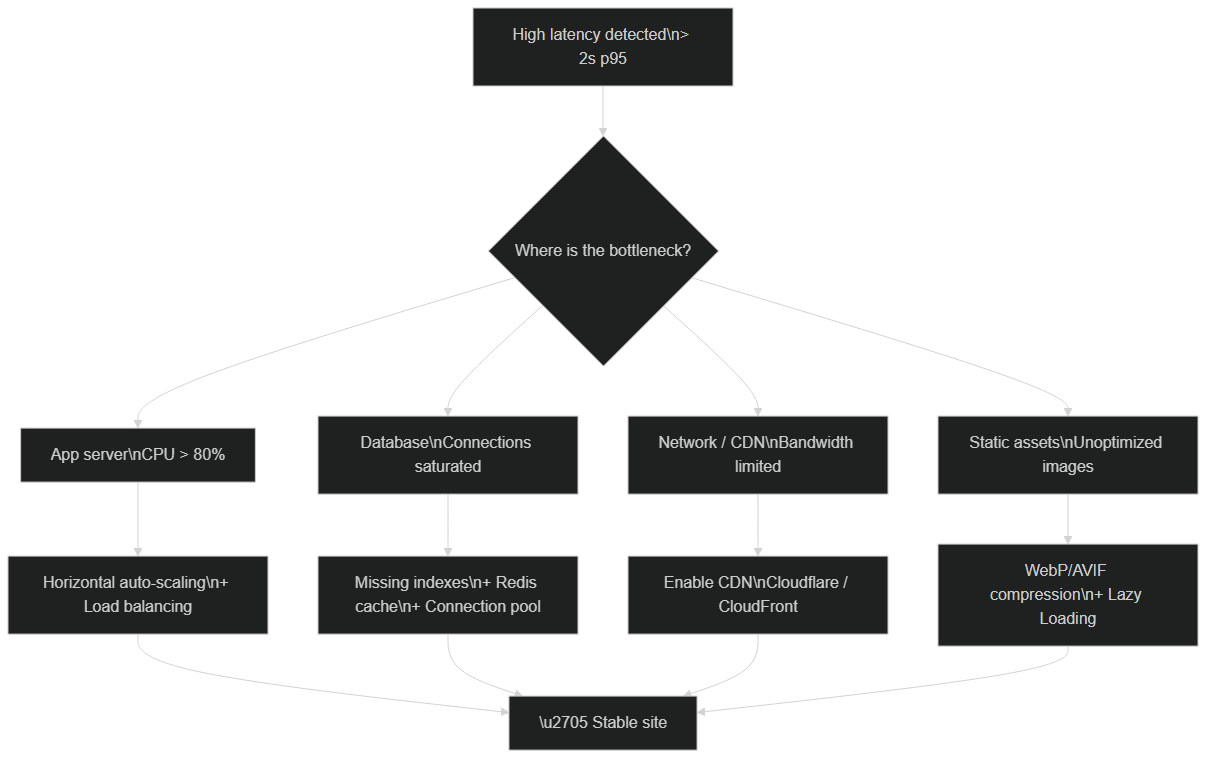 Identifying the bottleneck: each symptom (high CPU, saturated DB, limited network, heavy assets) points to a specific solution.
There are four main bottleneck categories, and each requires a different approach.
The application server is saturated when CPU consistently exceeds 80% or memory is near saturation. In this case, horizontal auto-scaling is the right answer: adding identical instances behind a load balancer distributes the load. A common mistake is "vertical scaling" — upgrading to a more powerful server. This is a temporary fix that creates a single point of failure.
The database is often the hidden bottleneck. Unlike application servers that duplicate easily, a relational database maintains shared state — which makes it fundamentally more complex to scale. Typical symptoms are slow queries (> 100ms for simple operations), connections at maximum, or deadlocks. The solution involves adding indexes on frequently filtered columns, fixing N+1 queries, setting up a connection pool (PgBouncer for PostgreSQL), and, as a last resort, read replicas to distribute reads.
Network and CDN become bottlenecks when you serve many assets from your main server. Every image, CSS file, font loaded from your server consumes bandwidth and connections. A CDN moves these requests to points of presence geographically close to the user, drastically reducing the load on your infrastructure.
Finally, poorly optimized assets (oversized images, non-minified JavaScript, uncompressed CSS) are a form of client-side bottleneck. They increase perceived loading time and can block page rendering. On this topic, our guide on divise-temps-chargement-par-10-optimisation-performance details the frontend optimizations that make a real difference.
CDN and Cache: The First Line of Defense Against Traffic Spikes
A CDN (Content Delivery Network) and caching are the two most cost-effective scalability optimizations. They don't eliminate the root problem, but they absorb the majority of traffic before it even reaches your infrastructure.
A CDN like Cloudflare (which protects roughly 20% of global internet traffic according to their 2025 report) or AWS CloudFront places your content in dozens of data centers distributed worldwide. When a user in New York visits your site hosted in Frankfurt, they receive assets from a nearby point of presence — in milliseconds, instead of crossing the Atlantic. For an e-commerce site with product images, JS and CSS files, a CDN can reduce bandwidth consumed on your main server by 80 to 95%.
But CDN only handles static content. For dynamic responses — personalized product pages, search results, user data — you need application-level caching.
Redis is today's standard for application caching in web architectures. Open-source, ultra-performant (< 1ms read latency according to Redis documentation), it can store the result of an expensive database query and serve it directly to subsequent requests without touching the database. The diagram below illustrates the concrete impact of Redis cache on response time during a traffic spike:
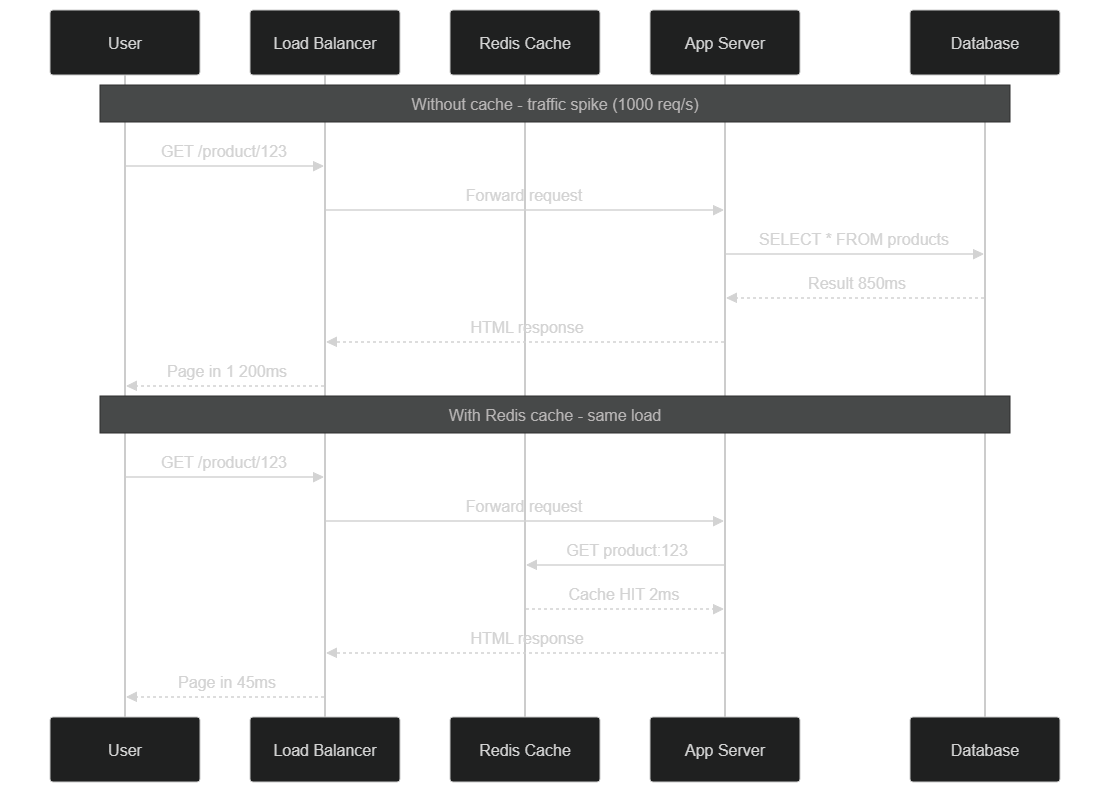 Without Redis cache, each request queries the database (850ms). With cache, the same endpoint responds in 45ms thanks to a Redis hit — a 95% reduction in response time.
The simplest caching strategy is HTTP cache: by adding the right Cache-Control and ETag headers to your responses, you allow browsers and intermediate proxies to cache responses locally. For content that changes rarely (product pages, blog articles), a max-age of 3600 seconds (1 hour) can already significantly reduce load on your server.
Static Site Generation (SSG) pushes the concept further: instead of generating each page on demand, you pre-generate all your pages at deploy time. A user visiting your blog article receives a pre-computed HTML file, with no server-side logic to execute. Next.js, the framework powering this site, implements this natively — the latest advances covered in nextjs-16-2-ce-qui-change-concretement-2026 further improve cache granularity.
How Does Automatic Scalability Work in Production?
1. Containerization (Docker)
Horizontal scalability rests on a fundamental principle: all instances of your application must be identical and interchangeable. That is exactly what Docker guarantees. By encapsulating your code, its system dependencies, and configuration into an immutable image, you get a deployable artifact that behaves exactly the same on your development machine, in staging, and in production.
Concretely, this means that adding a new instance under load no longer takes hours of manual server configuration, but seconds. The Docker image is pulled from a registry, the container starts, and the load balancer begins sending it traffic. This reproducible deployment is the foundation of any serious scalable architecture.
# Dockerfile
FROM node:18-alpine
WORKDIR /app
COPY package*.json ./
RUN npm install
COPY . .
EXPOSE 3000
CMD ["npm", "start"]
The practical benefits of containerization extend beyond scalability: identical development environment for the entire team, consistent deployments, complete dependency isolation between services, and easy rollback when something goes wrong.
2. Orchestration (Kubernetes)
Docker solves the packaging problem. Kubernetes (K8s) solves the management-at-scale problem. It is the system that decides how many instances of your application should run at any given moment, on which physical nodes they execute, and how they receive traffic.
The key component for automatic scalability is the Horizontal Pod Autoscaler (HPA). It continuously monitors metrics like CPU utilization or requests per second, and automatically adjusts the number of instances (called "pods" in Kubernetes vocabulary) based on thresholds you define.
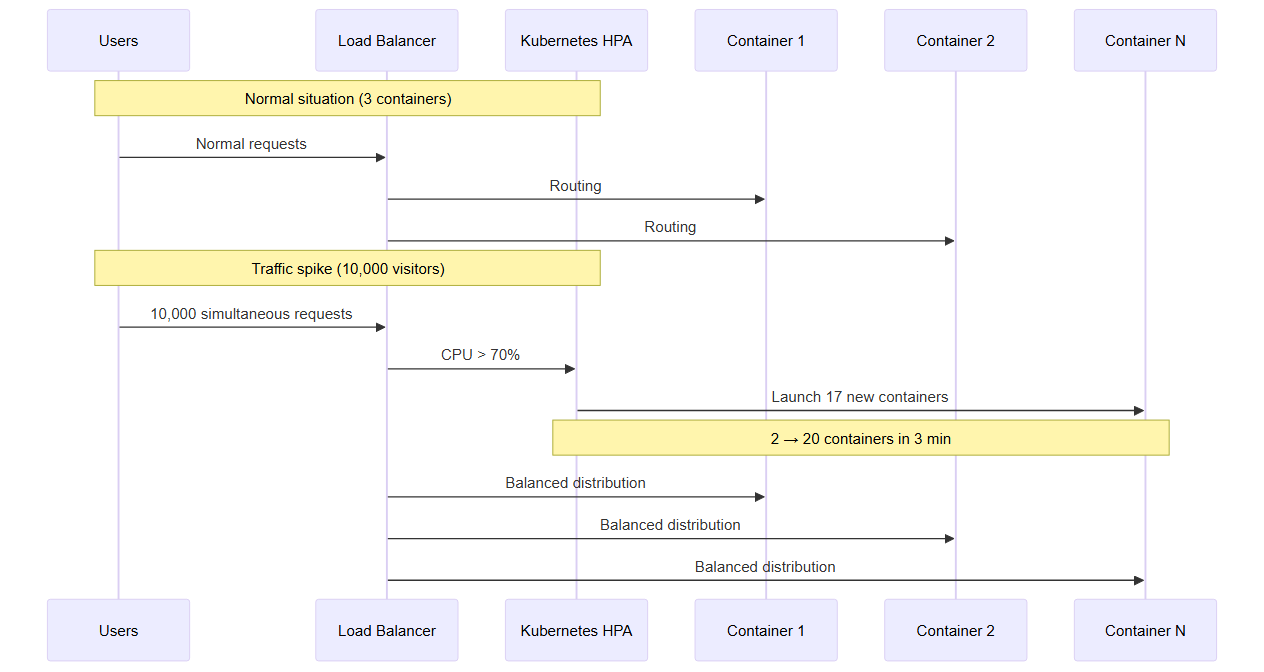 Kubernetes HPA detects CPU exceeding 70% and automatically launches new containers — 2 to 20 in 3 minutes.
# deployment.yaml
apiVersion: apps/v1
kind: Deployment
metadata:
  name: web-app
spec:
  replicas: 3  # 3 instances by default
  template:
    spec:
      containers:
      - name: app
        image: myapp:latest
---
apiVersion: autoscaling/v2
kind: HorizontalPodAutoscaler
metadata:
  name: web-app-hpa
spec:
  minReplicas: 3
  maxReplicas: 20
  targetCPUUtilizationPercentage: 70
  # If CPU > 70%, Kubernetes launches more pods automatically
The HPA's default behavior allows scaling from 3 to 20 instances in a few minutes, then automatically scaling back down when load decreases. You thus pay only for resources actually used.
3. Load Balancing (The Traffic Controller)
The load balancer is the traffic director. It receives all incoming requests and distributes them among your different instances according to a configurable algorithm. Nginx's "least_conn" (minimum connections) algorithm sends each new request to the instance with the fewest active connections — which naturally distributes load in a balanced way.
# nginx.conf
upstream backend {
    least_conn;  # Routes to least loaded server
    server app1:3000;
    server app2:3000;
    server app3:3000;
}

server {
    listen 80;
    location / {
        proxy_pass http://backend;
    }
}
In production, you typically don't use Nginx directly but a managed service like AWS ALB (Application Load Balancer), Google Cloud Load Balancing, or Cloudflare Load Balancing. These services integrate natively with each cloud provider's auto-scaling services and offer advanced features like automatic health checking (removing a failing instance from the distribution pool) and SSL termination.
Horizontal vs Vertical Scaling: Which Strategy to Choose?
The question comes up regularly: is it better to upgrade to a more powerful server (vertical scaling) or add servers (horizontal scaling)?
Vertical scaling (scale up) is straightforward: you upgrade your VPS from 2 vCPU / 4 GB RAM to 8 vCPU / 32 GB RAM. It's transparent for the application, requires no code changes, and can be done in a few clicks on cloud interfaces. But it has two major limitations. The first is physical: there is a maximum amount of resources you can put into one machine. The second is architectural: you still have a single point of failure. If that server goes down — network incident, hardware failure, restart for an update — your site is offline.
Horizontal scaling (scale out) is more complex to set up but infinitely more robust. Your application runs on N identical instances. If one goes down, the others continue. If traffic doubles, you add instances. This strategy requires your application to be "stateless": it must not store state in local memory between requests. User sessions must be in Redis or a database, not in server RAM.
In practice, the optimal strategy is hybrid: start with reasonable vertical scaling (8 vCPU, 16 GB RAM per instance), then switch to horizontal when you reach the limits of a single machine. Modern cloud providers (AWS, GCP, Azure) allow combining both approaches with auto-scaling group instances.
An important note: an application can remain slow even on 20 servers if the application architecture is poorly designed. Technical debt has a real cost, well documented in our analysis on pourquoi-application-coute-5x-plus-cher-maintenir-dette-technique.
How to Load Test Your Website Before a Real Traffic Spike?
The only way to know whether your infrastructure holds under load is to test it with simulated traffic before facing the real thing. Load testing is a mature practice, with excellent open-source tools.
k6 (maintained by Grafana Labs since their 2021 acquisition) is the most popular tool among development teams. Tests are scripted in JavaScript, results are clear, and it integrates easily into CI/CD pipelines. A basic k6 test can simulate 1,000 concurrent virtual users by progressively ramping up load over 5 minutes, then sustaining that load for 10 minutes to observe behavior under sustained pressure.
Locust is the Python alternative. Thanks to its coroutine-based architecture (greenlets), a single Locust agent can simulate thousands of concurrent users with modest memory consumption. Its strength is distribution: you can spread load generation across multiple machines to simulate very high volumes.
Artillery takes a declarative approach: you describe your load scenario in YAML, and Artillery handles execution. It is particularly suited for REST and GraphQL API testing. Artillery natively supports WebSockets and persistent connections, which is useful for real-time applications.
Whichever tool you choose, the types of tests to run before a high-traffic event are: the smoke test (1–5 virtual users) validates the system works under normal conditions. The load test (expected nominal load) verifies response times remain acceptable. The stress test (1.5× to 2× nominal load) finds the breaking point. The soak test (normal load for 2–4 hours) detects memory leaks and progressive degradation.
A fundamental principle: never run these tests directly in production. Use a staging environment that faithfully replicates production — same machine types, same network configuration, anonymized production data.
Monitoring and Alerts: Seeing the Problem Before It Happens
A scalable system without monitoring is like an airplane without instruments. You might be flying fine, but you'll only know when you hit the ground.
The open-source reference stack is Prometheus + Grafana. Prometheus collects metrics from your applications and infrastructure at regular intervals (scraping). Grafana visualizes them in interactive dashboards and manages alerts. This combination is used by thousands of teams in production, from startups to Fortune 500 companies.
The metrics to monitor as a priority for detecting an imminent crash are: latency at p95 and p99 (the slowest 5% and 1% — these are your most impacted users), 5xx error rate (alert threshold at 0.5%), CPU and memory utilization per instance (threshold at 80%), active database connections, and the queue length in your async task workers.
For teams that prefer a managed solution, Datadog and New Relic offer turnkey integration with most clouds and frameworks. The cost is higher (~$20–30 per host per month for Datadog in 2026), but onboarding is faster and the correlation features between traces, logs, and metrics are very powerful.
The most important aspect is not the tool — it is the alerting policy. An alert that fires when the server is already saturated is useless. The best alerts are predictive: "if this trend continues, in 20 minutes the CPU will be at 90%". Tools like Grafana's time series forecasting enable this type of proactive alerting.
Incident Response Plan: What to Do When It Crashes Anyway?
Even with the best infrastructure, incidents happen. The question is not "will my site ever have a problem?" but "when that problem occurs, how long will it take to resolve?". The November 2025 Cloudflare outage was a reminder that even infrastructure giants are not immune — and that resilience is built by anticipating these scenarios.
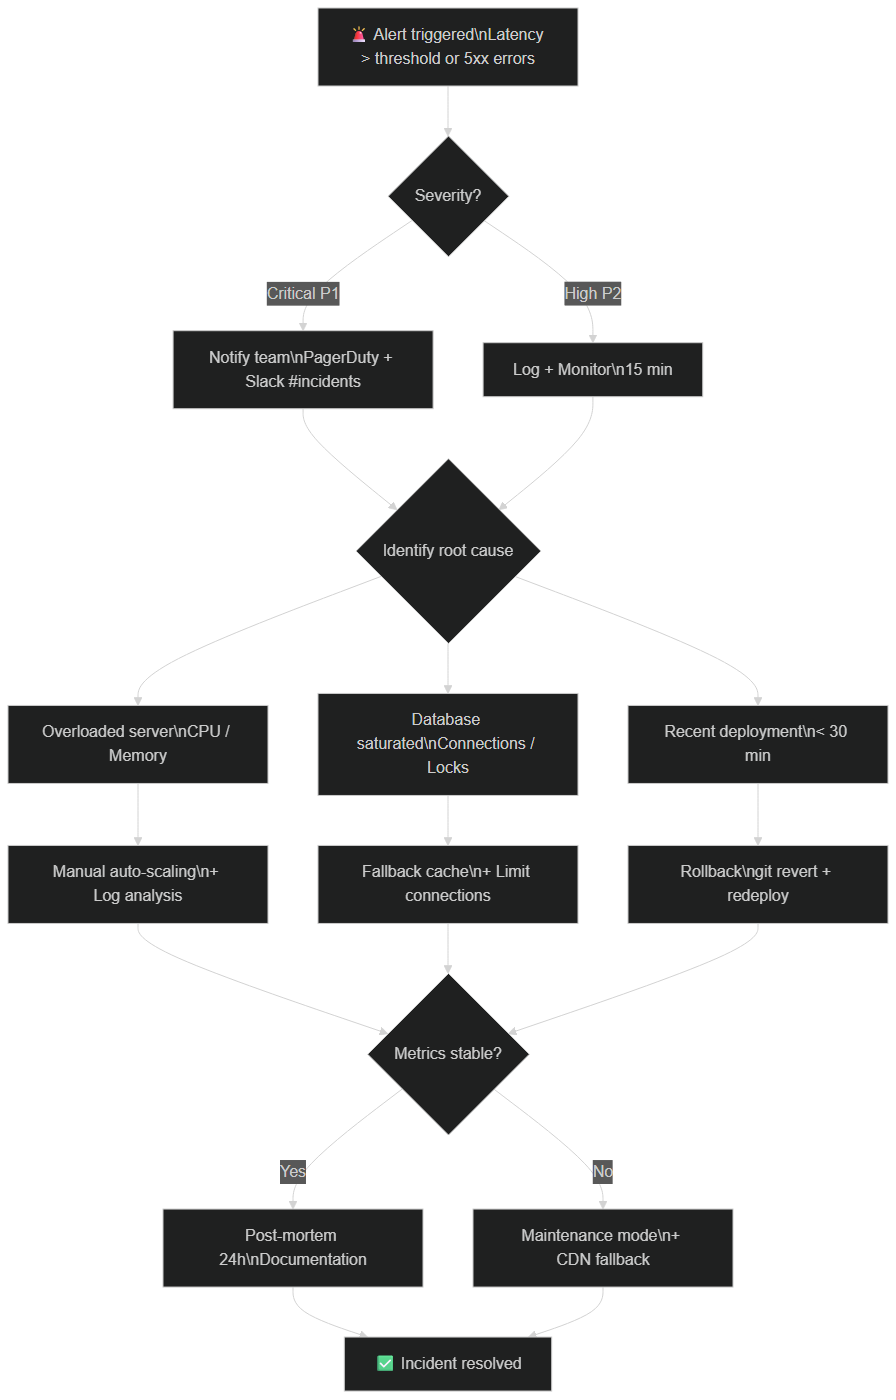 Incident response plan: classify severity, notify team, identify root cause (server, DB, or recent deployment), act, verify stability, then document.
A solid incident response plan structures itself in five steps. Detection: your monitoring system sends an alert on PagerDuty or Slack #incidents with context (exceeded metric, threshold, time). Classification: the on-call engineer assesses severity — P1 (site down, immediate revenue impact) or P2 (degradation, partial impact). Investigation: checking dashboards, recent logs, and the last deployment to identify the cause. Corrective action: either manual scaling, a deployment rollback, or activating a circuit breaker. Communication: keeping stakeholders informed in real time via a dedicated channel.
The post-mortem is the often-skipped but most valuable step. Documenting the incident — timeline, root cause, impact, corrective and preventive actions — transforms a problem into learning. The best tech teams publish their post-mortems publicly (Google, Cloudflare, GitHub do this regularly) because transparency builds trust.
Database Optimization: The Forgotten Bottleneck
The database is often the last bottleneck addressed, but frequently the first to saturate. Unlike application servers that duplicate easily, a relational database maintains consistent state — making it fundamentally more complex to scale.
The first and most profitable optimization is adding indexes on frequently filtered columns. A query SELECT * FROM orders WHERE user_id = 42 without an index on user_id scans the entire table. With the index, it is a near-instantaneous lookup. PostgreSQL's EXPLAIN ANALYZE command identifies unindexed queries and measures their actual cost.
N+1 queries are a classic ORM anti-pattern (Sequelize, Prisma, ActiveRecord). To display a list of 100 orders with the customer name, a naïve implementation runs 1 query for orders + 100 queries for customers = 101 queries. With a proper JOIN or include clause, it is 1 query. Under heavy traffic, this difference is the boundary between a smooth site and one that collapses.
Connection pooling is critical as soon as you have multiple application instances. PostgreSQL has a limit of simultaneous connections (typically 100 by default). With 10 application instances each having a pool of 15 connections, you are already at 150 connections — beyond the limit. PgBouncer is the standard pooling proxy for PostgreSQL: it maintains a limited number of connections to the DB and shares them among all instances.
For read-intensive applications (blogs, product catalogs, dashboards), read replicas allow distributing SELECT queries across multiple secondary nodes, reserving the primary node for writes. AWS RDS, Google Cloud SQL, and Supabase all support read replicas transparently.
Concrete Case: An E-Commerce Startup During Black Friday
The most telling example remains that of an e-commerce startup facing its first real load test during Black Friday.
Year 1 — single server: The site runs on a €40/month VPS. Everything works fine under normal conditions (200–300 concurrent visitors). Black Friday arrives, the site starts slowing down at 8:00 AM. By 10:00 AM, 503 errors are multiplying. By 11:30 AM, the site is completely offline. Abandoned carts, Google Ads campaigns running, influencers who posted that morning — all wasted. Estimated loss: €50,000 in potential revenue.
Year 2 — scalable architecture: The team sets up Docker + Kubernetes on GKE, a Cloudflare CDN, a Redis cache for product pages and search results, and k6 load tests in staging two weeks before the event. Black Friday arrives. At 8:30 AM, traffic starts climbing. The HPA detects the CPU threshold breach at 8:35 AM. In under 3 minutes, the cluster has gone from 2 to 20 instances. The site never exceeded 400ms median latency.
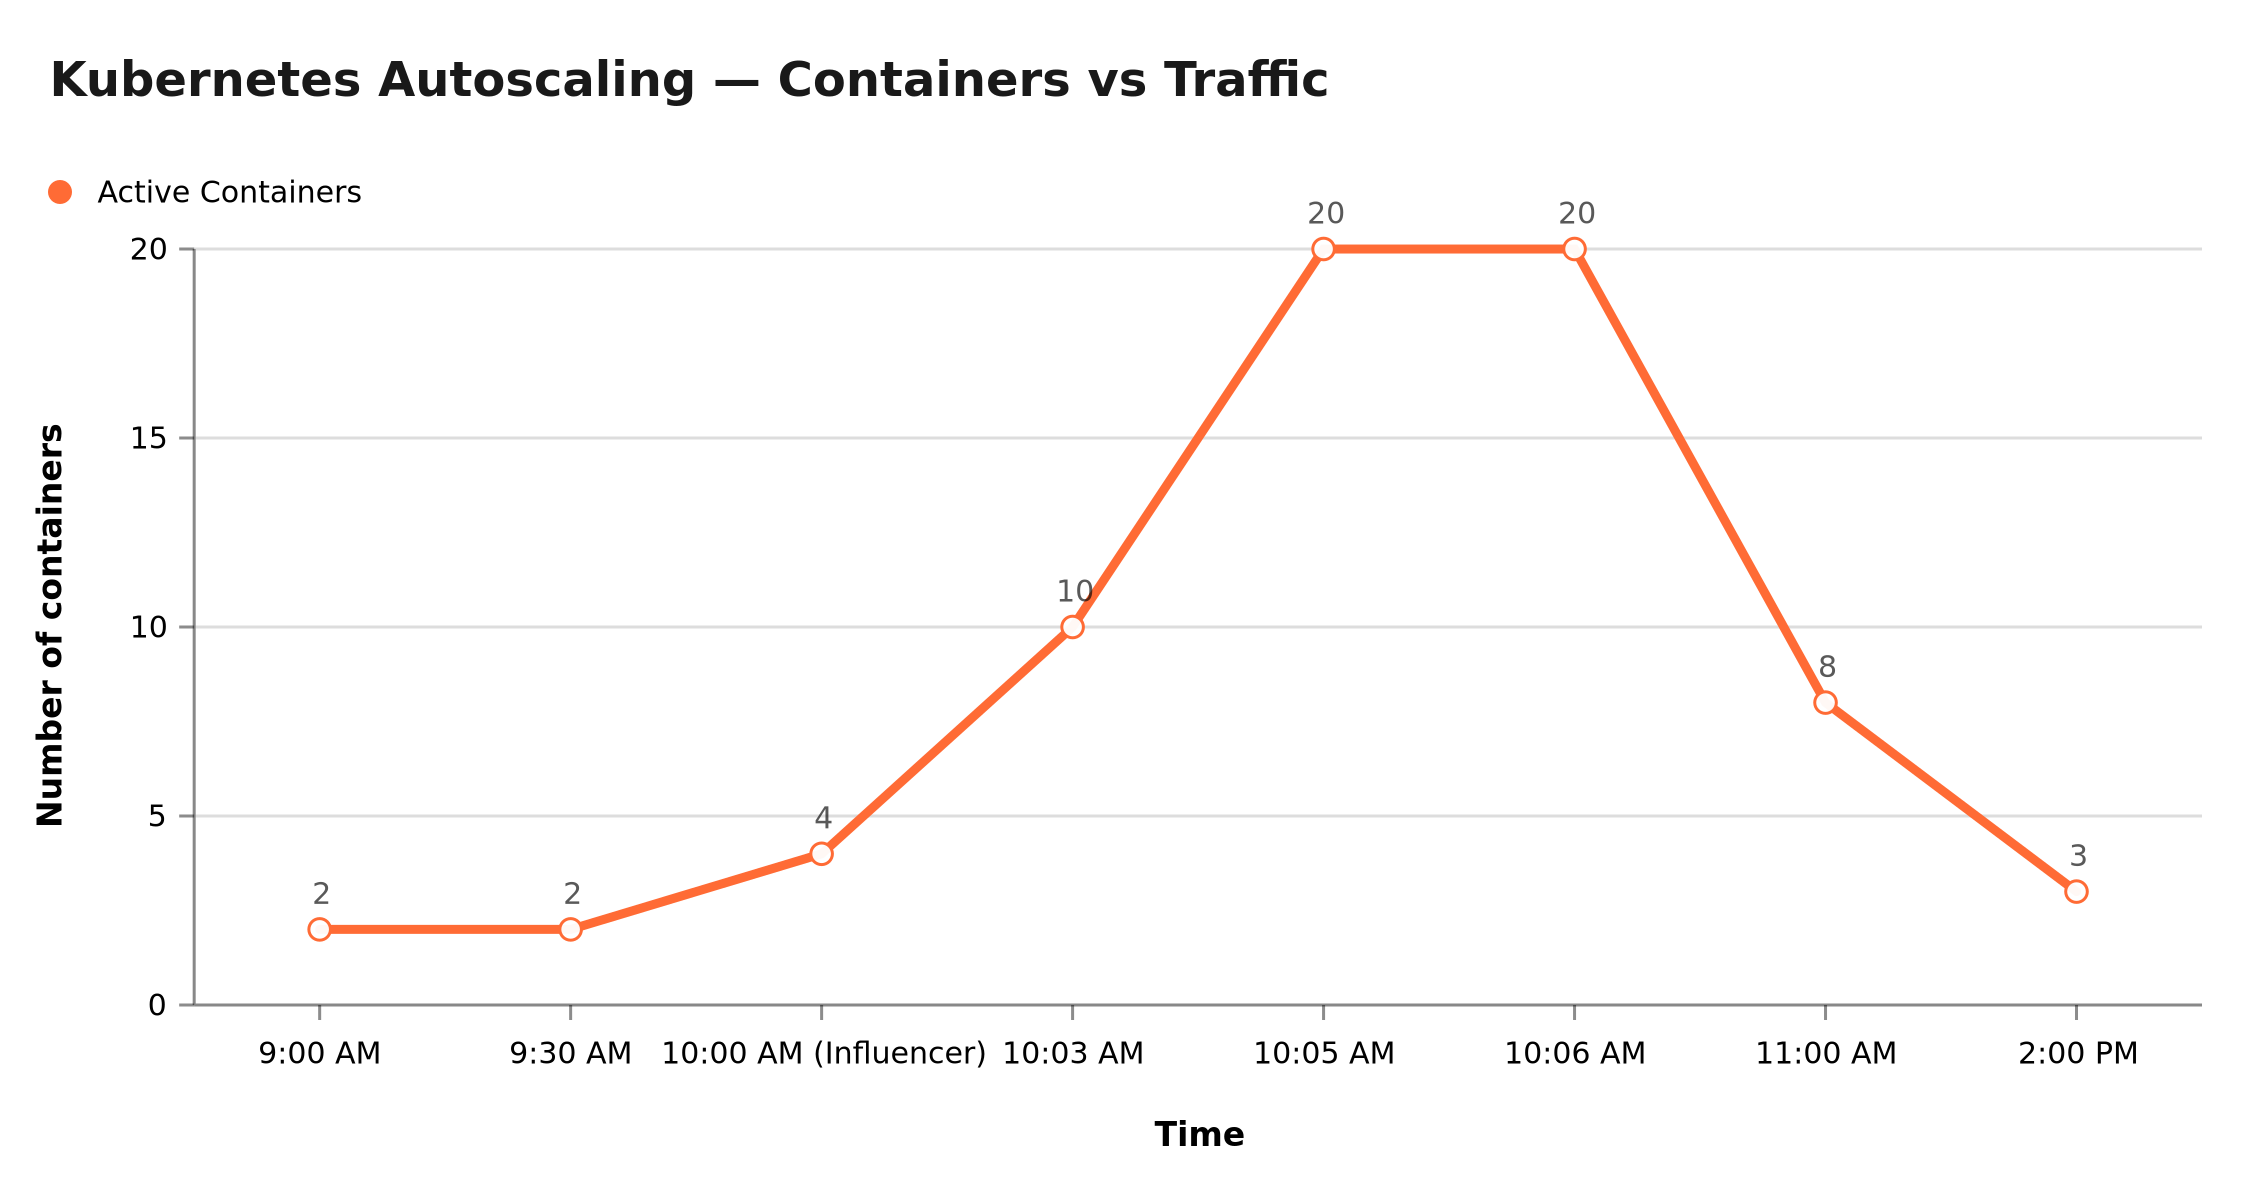 Kubernetes autoscaling in action: the system goes from 2 to 20 containers in 3 minutes during the traffic spike, then automatically scales back down.
Result: Sales record. No lost cart pages. No critical alerts in the night. On the morning of November 25th, the team drank their coffee in peace.
Cumulative Gains: What Each Optimization Layer Delivers
Scalability optimizations don't exclude each other — they stack. The following diagram shows, for illustrative purposes, how average response time evolves as you layer optimizations — starting from an unoptimized architecture through a complete stack.
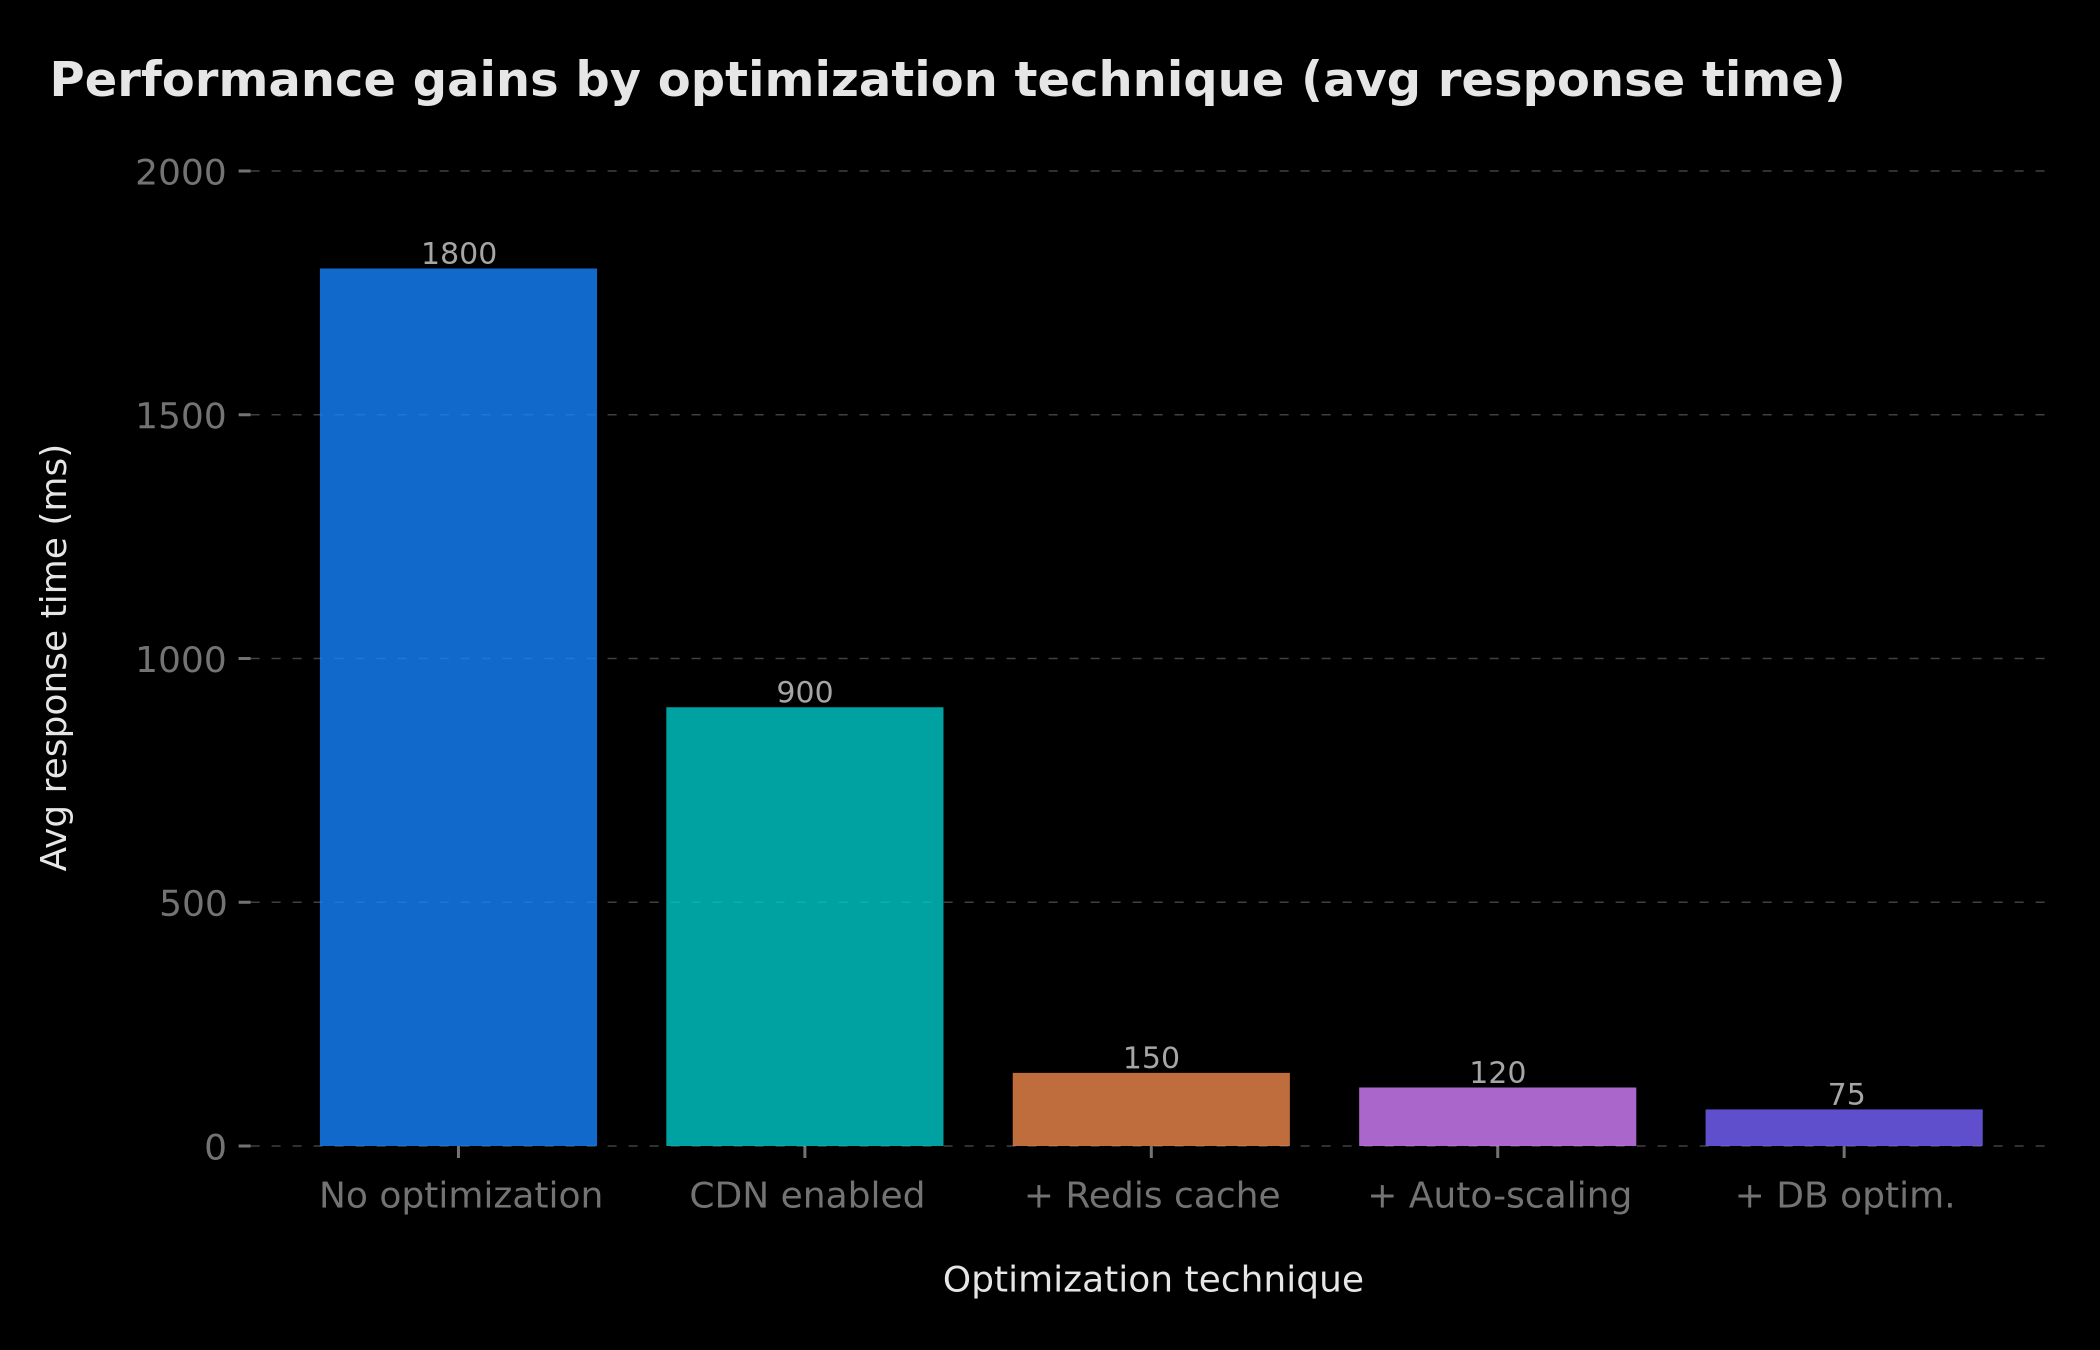 Cumulative impact of each optimization on response time: CDN alone reduces load by 50%, Redis further reduces by 83%, auto-scaling and DB optimization finalize the improvement.
The CDN absorbs assets and reduces raw load on your backend. Redis cache eliminates most database round-trips. Auto-scaling ensures capacity adapts to demand. Database optimization (indexes, pooling, read replicas) handles residual queries efficiently. These four layers, combined, can transform a site that struggles under 500 concurrent users into a platform that comfortably handles 50,000 requests per minute.
Why It's Vital for Your Business
A scalable infrastructure is not an expense — it is insurance and a growth accelerator.
Availability is the first value. A 99.9% SLA (what you get with a single server and a good host) corresponds to 8h45 of allowed downtime per year. A 99.99% SLA (redundant, multi-zone infrastructure) reduces that figure to 52 minutes. For an e-commerce generating €10,000 in daily revenue, this difference potentially represents thousands of euros in avoided losses.
Economy is a second, often counter-intuitive argument. A scalable infrastructure costs you less than a permanently oversized server. At night, when traffic is minimal, the HPA scales down to 2–3 instances. On Black Friday weekend, it climbs to 20. You pay exactly what you consume. Compare that to a fixed server sized for maximum peak — you pay 100% of the time for capacity used at only 20% on average.
Finally, operational peace of mind is invaluable. Your team can deploy on Monday morning without fear of breaking production, sleep during important commercial events, and focus energy on growth rather than firefighting.
Conclusion: Scalability, an Infrastructure That Grows With You
Website scalability is not built overnight, but it is planned from the very first lines of architecture. The foundations are straightforward: containerize with Docker, orchestrate with Kubernetes, cache with Redis, distribute assets with a CDN, and load test before every major traffic event.
The key message is this: your next growth opportunity should not be held back by your infrastructure. A viral article, press coverage, a campaign that takes off — these moments don't always repeat themselves. Your site needs to be ready to receive them.
Setting up Kubernetes is complex at first — it is specialized expertise that doesn't happen in 10 minutes. But once in place, it is your business's life insurance. It is the difference between an amateur project and a platform capable of welcoming the entire world. And before even getting there, optimizing loading time can already multiply your conversions by 1.25.
A €5 VPS is enough for a blog. For a business that wants to grow — that wants to be ready when opportunity knocks — investing in a scalable architecture is non-negotiable.
Additional Resources:
🚀 Complete Guide: Pro App Development I explain how to architect scalable applications: Dockerization, scaling strategies, Cloud architecture. 👉 Access the Complete Guide
Would Your Site Hold If 10,000 People Arrived Right Now? 👇
Tags
FAQ
How do I know if my website is about to crash?
The warning signals are: p95 latency exceeding 2 seconds, 5xx error rate above 1%, server CPU consistently above 80%, and database connection pool saturated. A monitoring tool like Grafana (open-source) or Datadog lets you track these thresholds and send alerts before the site goes down.
What is the difference between horizontal and vertical scaling?
Vertical scaling means upgrading an existing server's resources (more RAM, more CPU). It is simple but physically limited and creates a single point of failure. Horizontal scaling adds identical instances behind a load balancer. This is the recommended strategy for critical applications as it provides high availability and near-unlimited capacity.
How do you load test a website before a real traffic spike?
Three open-source tools are industry standards: k6 (JavaScript scripts, ideal for dev teams), Locust (Python, great for distributed testing), and Artillery (YAML/JavaScript, easy to integrate in CI/CD pipelines). The goal is to simulate your expected peak × 1.5 to validate that the infrastructure holds. These tests should always run in staging, never directly in production.
Do CDN and Redis cache alone prevent a crash?
For most content-driven sites (e-commerce, blogs, public SaaS), yes: a well-configured CDN absorbs 80–95% of static traffic, and Redis reduces dynamic endpoint response times from 850ms to under 50ms. But for write-heavy applications (bookings, transactions), auto-scaling and database optimization are also required.
How much does it cost to make a website scalable?
Setting up a CDN (Cloudflare free to Pro ~$20/month), Redis cache (Upstash from $0, Redis Cloud from ~$7/month) and a managed Kubernetes cluster (GKE, EKS, AKS from ~$100/month for a dev cluster) represents an investment between $200 and $800 per month depending on your load. BOVO Digital performs architecture audits to precisely size your infrastructure.
Does your site book meetings — or just present you?
We open your URL together, mark the 3 leaks, and tell you whether a fix is enough or a rebuild is required.
- 30 min
- No commitment
- Action plan
Vicentia Bonou
Full Stack Developer & Web/Mobile Specialist. Committed to transforming your ideas into intuitive applications and custom websites.


